


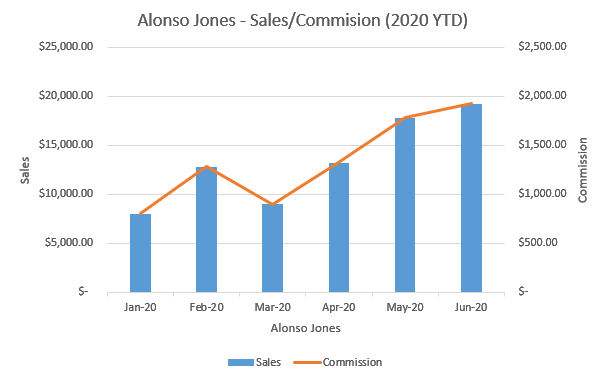
How to Create Chart Templates in Excel
When creating a chart or graph in Excel, you will sometimes want to create a template of the chart you made so you can reuse it in the future. Chart templates are an excellent way to save time, and create consistent projects, when working with Excel charts and graphs.
-->How to Create a Chart Template
Step 1: Select the Chart you want use to create the template
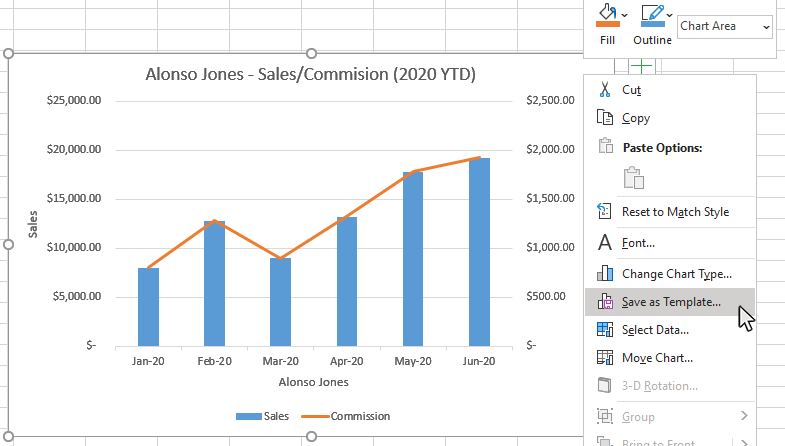
Use the cursor to click on a blank area on your chart. Make sure to click on a blank area in the chart. The border around the entire chart will become highlighted. Once you see the border appear around the chart, then you know it is ready to be changed.
Step 2: Right Click, and select Save As Template option
Right Click on your selected chart and select the Save As Template option, this will open a dialog box where you can name your new template.
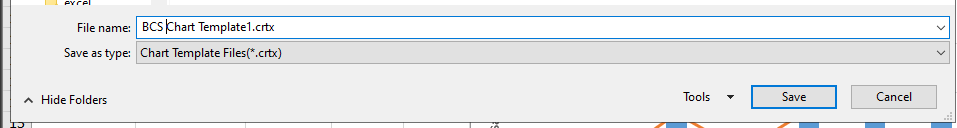
Step 3: Name the template
In the dialog box that appears, type in a name for the template and click the Save button. That is it. Now you have an Excel Chart Template that you can use for future charts. In the next section, we will look at how to apply a custom chart template to a new set of data.
How to Apply a Chart Template
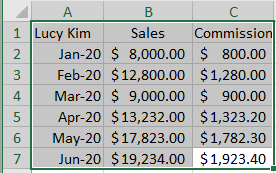
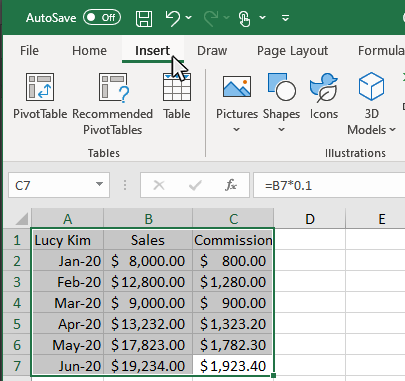
Step 1: Select your chart data
Use your mouse to select the data you would like to include in your chart.
Step 2: Click the Insert Tab
Once the chart data is selected, click in the Insert tab to display insert Chart options on the ribbon.
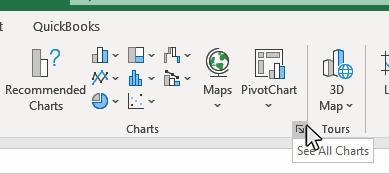
Step 3: Click on the See All Charts button
In the Chart section of the Insert tab, move you mouse to the bottom right corner, then click the See All Charts button.
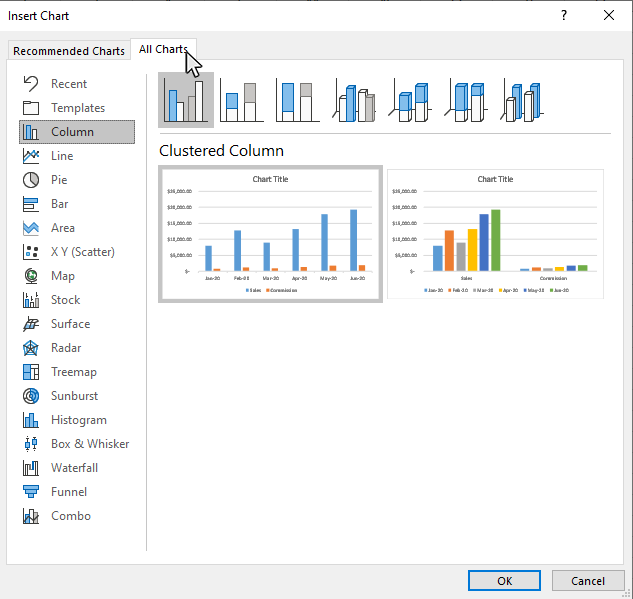
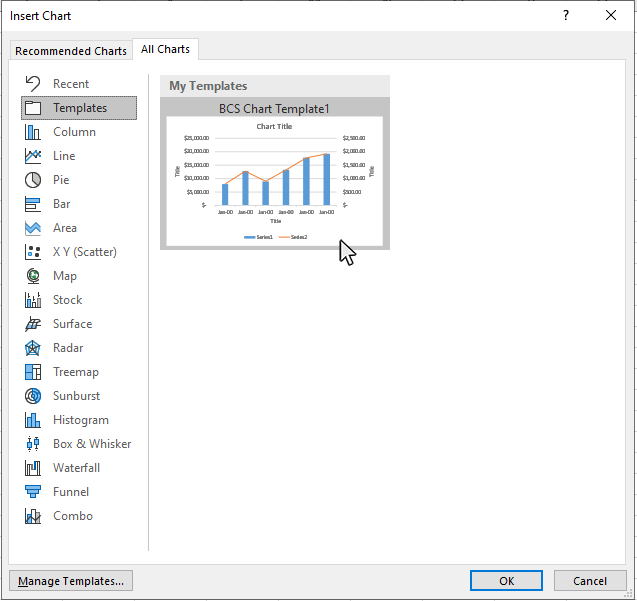
Step 4: Click on the All Charts tab in the Insert Chart window
In the Insert Chart window, click on the All Charts tab.
Step 5: Click on the Templates option on the All Charts tab
In the Chart section of the Insert tab, move you mouse to the bottom right corner, then click the See All Charts button.
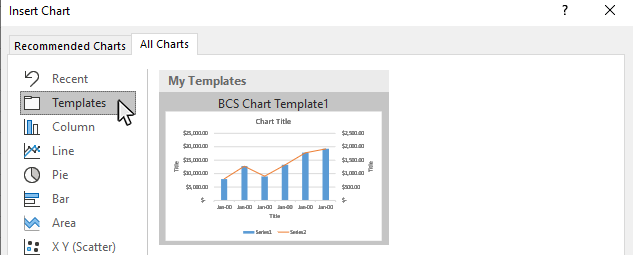
Step 6: Select the custom template you want to use, and click OK
Pick the template you want to use from the templates screen and click OK.
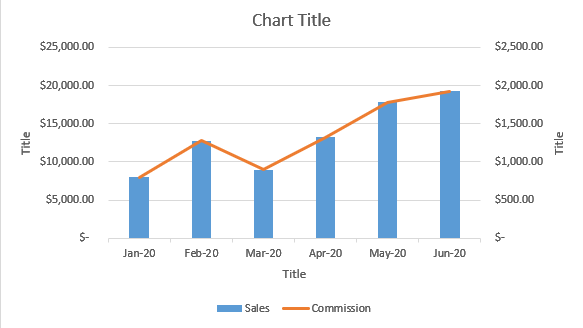
Excel will then apply the template formatting to the new chart.
Topic #13
How to Create Sparklines in Excel
Thanks for checking out this tutorial. If you need additional help, you can check out some of our other free Excel Chart tutorials, or consider taking an Excel class with one of our professional trainers.