


How to Filter Charts in Excel
Once you have created a chart in Excel, you may want to filter the information that is visible on your chart to focus on specific details or data points. This tutorial will teach you how to filter your Excel chart.
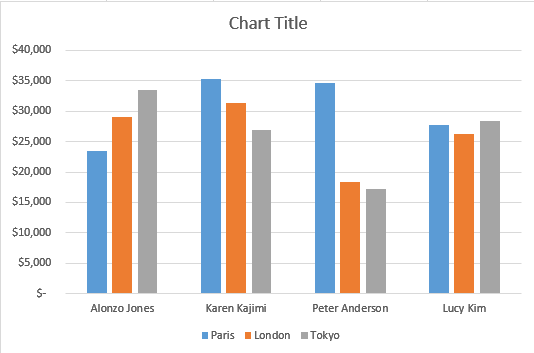
Step 1: Click on a blank area of the chart
Use the cursor to click on a blank area on your chart. Make sure to click on a blank area in the chart. The border around the entire chart will become highlighted. Once you see the border appear around the chart, then you know the chart editing features are enabled.
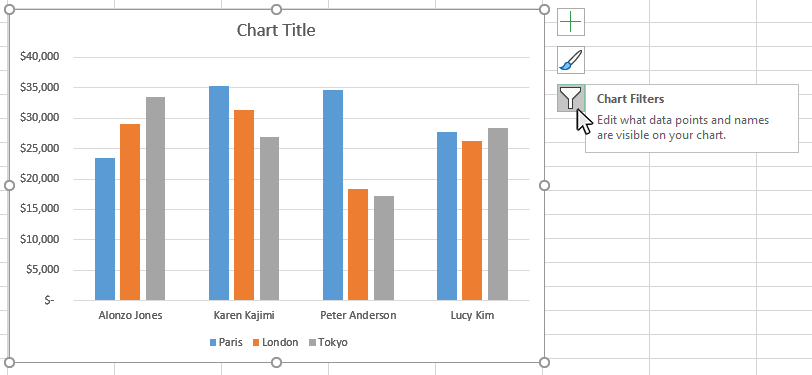
Step 2: Click on the Chart Filters button next to the chart
Once the chart name area is highlighted, you will see the Chart Filters button next to upper right hand side of the chart. The button looks like a funnel. Doing this will open the Chart Filters window.
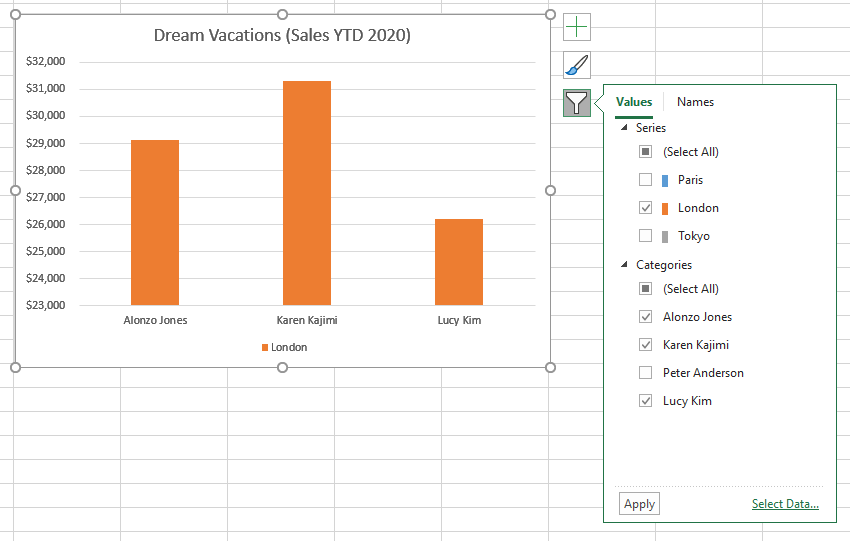
Step 3: Select the data you want to appear in the Chart Filters window
Once you have opened the Chart Filters window, you will see a number of items you can select or deselect to filter your chart data. Once you have made your changes, click the Apply button and your changes will appear on the chart.
Topic #11
How to Make Trendlines in Excel Charts
Thanks for checking out this tutorial. If you need additional help, you can check out some of our other free Excel Chart tutorials, or consider taking an Excel class with one of our professional trainers.