


How to Make Dual Axis Charts in Excel
When creating a chart in Excel, you will sometimes want to show two different types of data on the same chart. You can accomplish this by creating a Dual Axis chart, also known as a Combo chart. This tutorial will teach you how make and format Dual Axis charts in Excel.
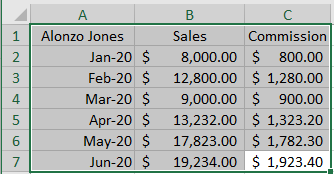
Step 1: Select your chart data
Use your mouse to select the data you would like to include in your chart.
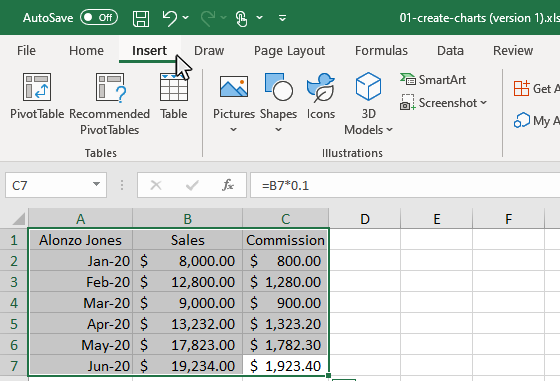
Step 2: Click the Insert Tab
Once the chart data is selected, click in the Insert tab to display insert Chart options on the ribbon.
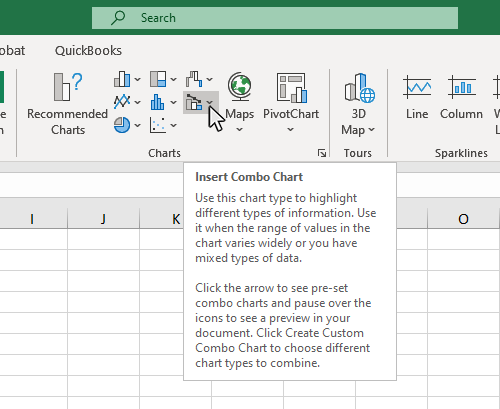
Step 3: Mouse Over the Insert Combo Chart Button and click the down arrow
In the Chart section of the Insert tab, move you mouse over the Insert Combo Chart button, then click the down arrow to display the sub-menu.
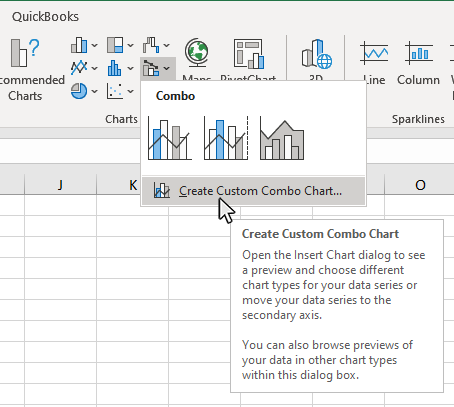
Step 4: Select Create Custom Combo Chart button
From the Insert Combo Chart sub-menu, click the Create Custom Combo Chart button to open up the customization window for the Combo Chart.
Step 5: Select the type of Combo Chart you want to use
In the Insert Combo chart Menu, select the type of Combo Chart you want to use.
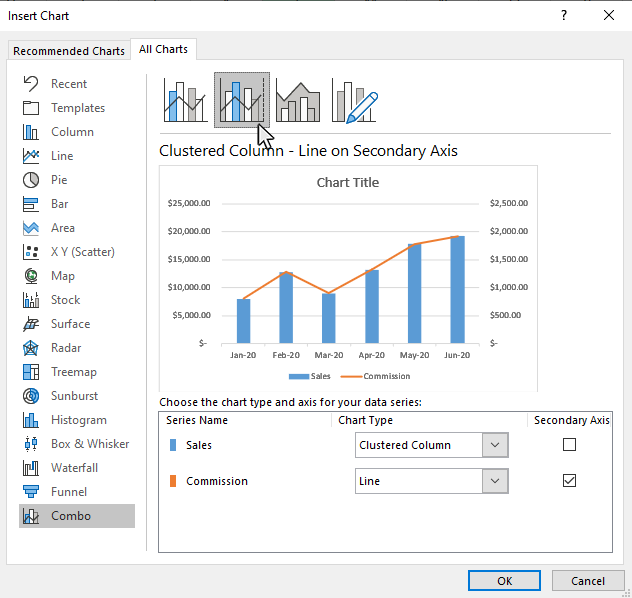
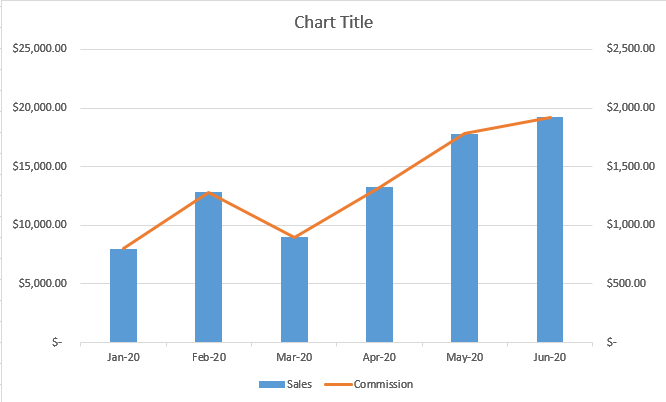
Once you have selected the appropriate option, click OK and your Dual-Axis combo chart will appear.
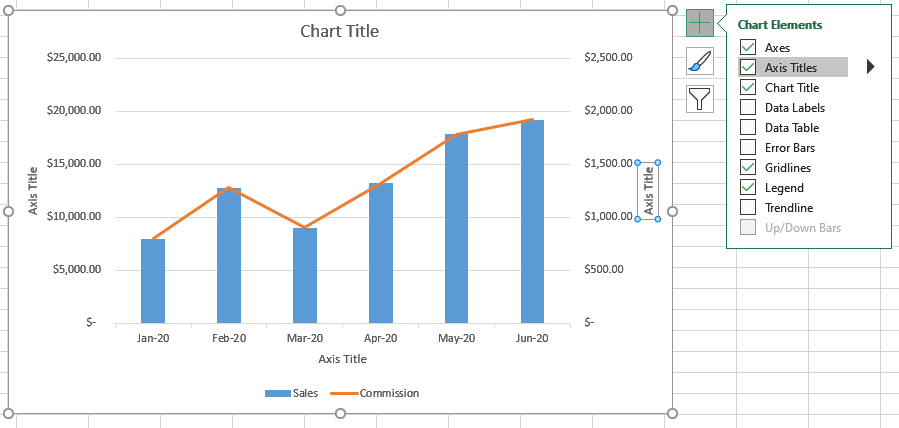
Step 6: Add Axis Titles to your Combo Chart
Once you have created your Combo chart, click the chart in a blank area, then click the Chart Elements button, and check the Axis Titles option. This will display title fields for each chart axis. If you triple click on the chart axis it will let you type in a new value for the axis name.
Step 7: Edit Axis Titles on your Combo Chart
If you triple-click on the chart axis text box it will let you type in a new value for the axis name.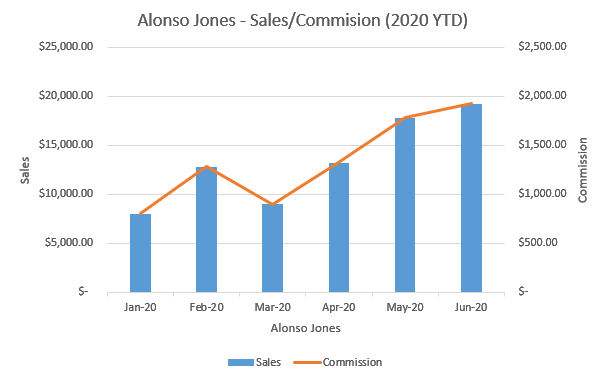
Topic #13
How to Create Chart Templates in Excel
Thanks for checking out this tutorial. If you need additional help, you can check out some of our other free Excel Chart tutorials, or consider taking an Excel class with one of our professional trainers.