


What Types of Chart Does Excel Offer
Currently, Microsoft Excel offers 17 different types of charts for you to use. Each of these chart types can be edited in numerous ways to help you get the look that you want. This tutorial will look at each type of excel chart and briefly discuss why it is used.
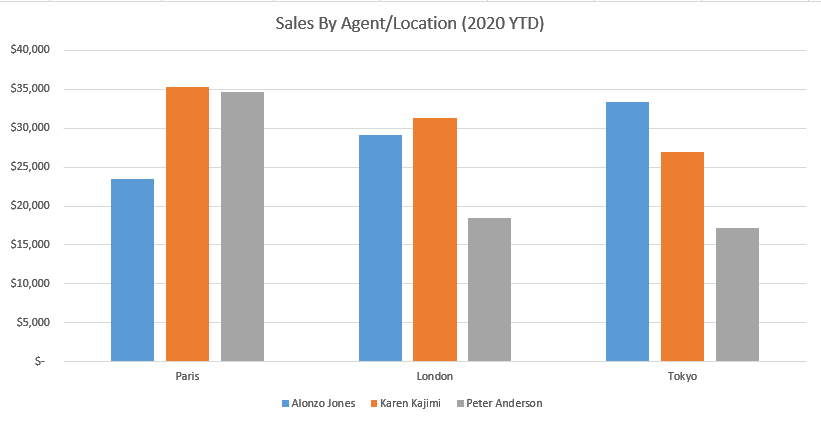
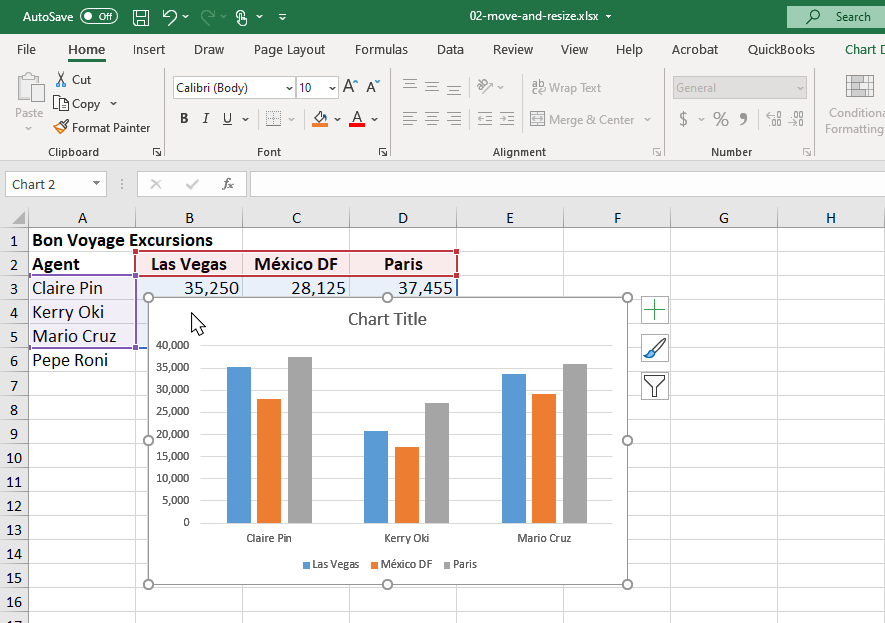
1. Clustered Column Chart (Column Chart)
A clustered column chart, or column chart, is used to display a series of two or more data sets in vertical clustered columns. The vertical columns are grouped together, because each data set shares the same axis labels. Clustered Columns are beneficial in directly comparing data sets.
Related Tutorial: How to Build a Clustered Column Chart in Excel
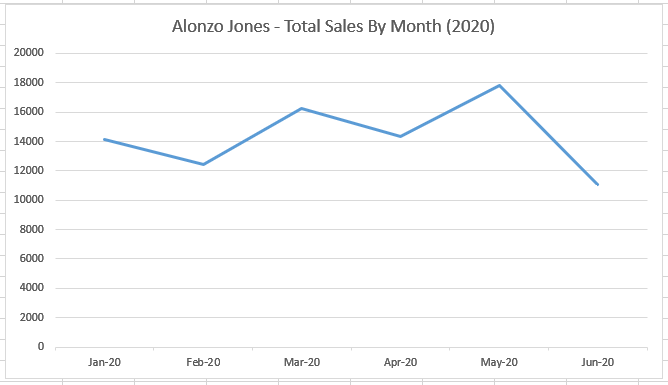
2. Line Chart
A line chart, or line graph, is used to display how one or more data set changes over time by connecting data points via linear segments. Line Charts are beneficial in comparing small changes data over time.
Related Tutorial: How to Build a Line Chart in Excel
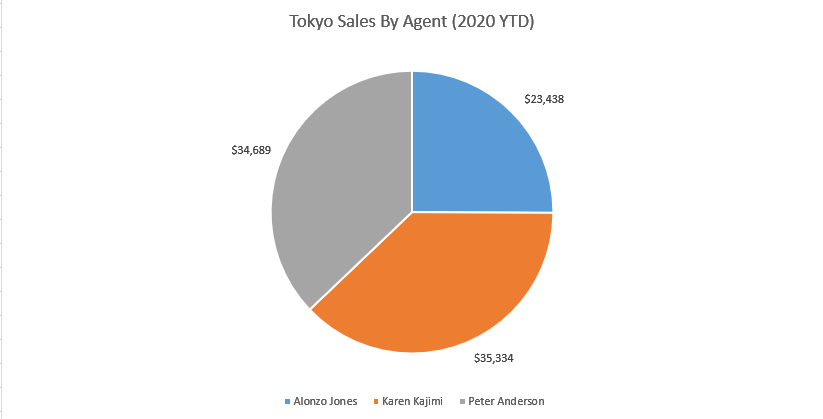
3. Pie Chart
A Pie chart is used to display the percentage, or proportional, amount each data point accounts for in the total amount of a data set. Pie charts are ideal for displaying data sets with six or fewer data points.
Related Tutorial: How to Build a Pie Chart in Excel
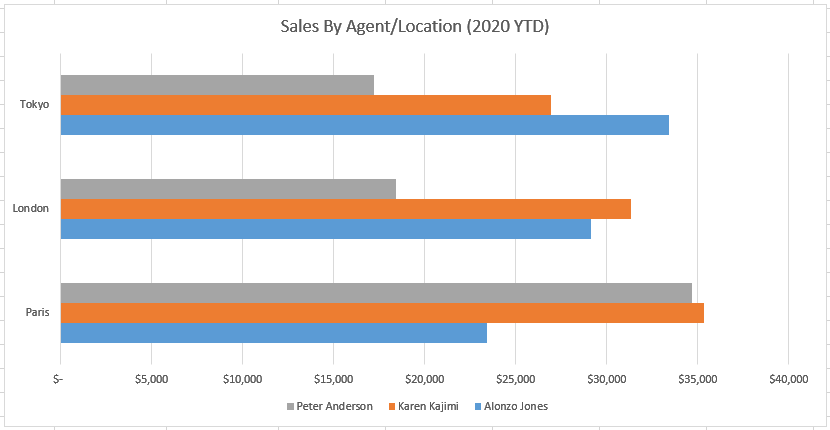
4. Clustered Bar Chart
A Clustered Bar chart, or Bar chart, is used to display a series of two or more data sets in horizontal clustered columns. The horizontal columns are grouped together, because each data set shares the same axis labels. Clustered Bar charts are beneficial in directly comparing data sets.
Related Tutorial: How to Build a Clustered Bar Chart in Excel
Related Tutorial: How to Build a Gantt Chart in Excel
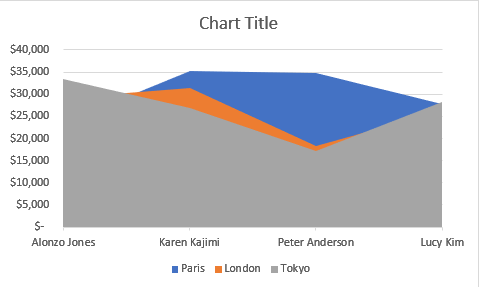
5. Area Chart
Area charts are a form of line chart with the area filled in below each line with a color code for each data set. Area charts are beneficial in directly comparing two or more data sets over time, and visually highlighting the differences in those data sets at points in time with the use of color.
Related Tutorial: How to Build a Area Chart in Excel
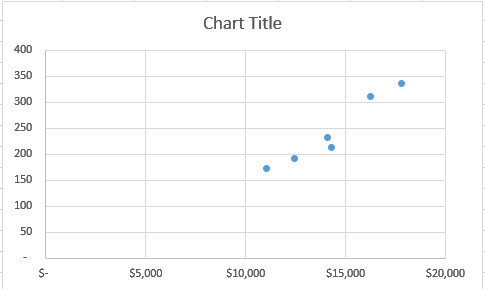
6. Scatter Chart (X/Y)
A Scatter chart, or Scatter Plot, is used to display two or more sets of data to look for correlation and trends between the sets of data values. Scatters plots are useful in identifying trends in data sets, and establishing the strength of correlation between values in those data sets.
Related Tutorial: How to Build a Scatter Chart in Excel
Related Tutorial: How to Build a Bubble Chart in Excel
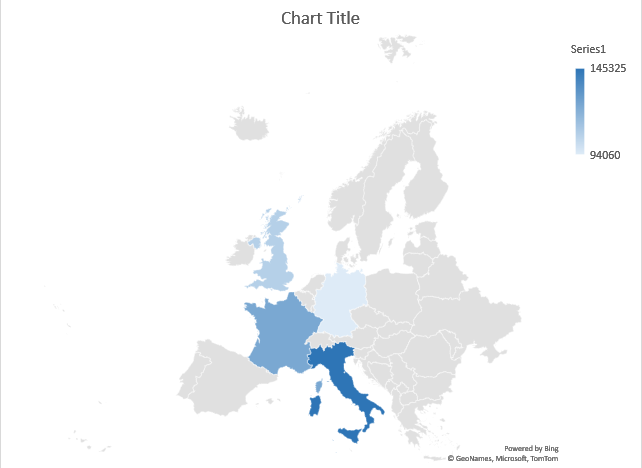
7. Filled Map Chart
A Filled Map chart, is used to display high-level chart data within a map. Filled Maps are beneficial in visually displaying data sets by geographic location.
Related Tutorial: How to Make a Filled Map Chart in Excel
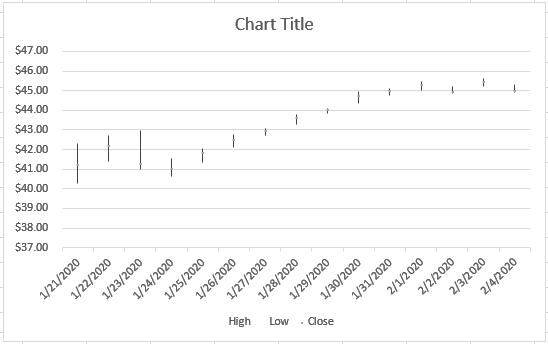
8. Stock Chart
A Stock chart, or stock graph, is used to display the trend of a stock's price over time. Some of the values that can be used in these charts are Opening Price, Closing Price, High, Low, and Volume. Stocks charts are beneficial in visualizing stock price trends and volatility over time.
Related Tutorial: How to Build a Stock Chart in Excel
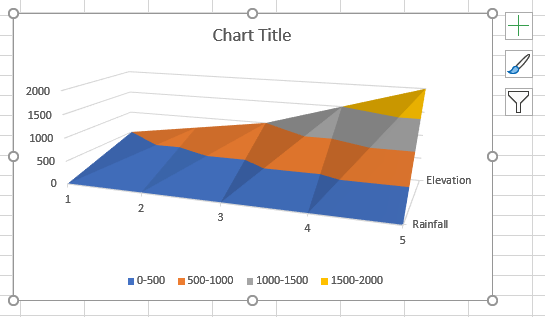
9. Surface Chart
A clustered column chart, or column chart, is used to display a series of two or more data sets in vertical clustered columns. The vertical columns are grouped together, because each data set shares the same axis labels. Clustered Columns are beneficial in directly comparing data sets.
Related Tutorial: How to Build a Surface Chart in Excel
10. Radar Chart
A Radar chart, or column chart, is used to display a series of two or more data sets in vertical clustered columns. The vertical columns are grouped together, because each data set shares the same axis labels. Clustered Columns are beneficial in directly comparing data sets.
Related Tutorial: How to Build a Radar Chart in Excel
11. Treemap Chart
A clustered column chart, or column chart, is used to display a series of two or more data sets in vertical clustered columns. The vertical columns are grouped together, because each data set shares the same axis labels. Clustered Columns are beneficial in directly comparing data sets.
Related Tutorial: How to Build a Treemap Chart in Excel
12. Sunburst Chart
A clustered column chart, or column chart, is used to display a series of two or more data sets in vertical clustered columns. The vertical columns are grouped together, because each data set shares the same axis labels. Clustered Columns are beneficial in directly comparing data sets.
Related Tutorial: How to Build a Sunburst Chart in Excel
13. Histogram Chart
A clustered column chart, or column chart, is used to display a series of two or more data sets in vertical clustered columns. The vertical columns are grouped together, because each data set shares the same axis labels. Clustered Columns are beneficial in directly comparing data sets.
Related Tutorial: How to Build a Histogram Chart in Excel
Related Tutorial: How to Build a Pareto Chart in Excel
14. Box and Whisker Chart
A clustered column chart, or column chart, is used to display a series of two or more data sets in vertical clustered columns. The vertical columns are grouped together, because each data set shares the same axis labels. Clustered Columns are beneficial in directly comparing data sets.
Related Tutorial: How to Build a Box and Whisker Chart in Excel
15. Waterfall Chart
A clustered column chart, or column chart, is used to display a series of two or more data sets in vertical clustered columns. The vertical columns are grouped together, because each data set shares the same axis labels. Clustered Columns are beneficial in directly comparing data sets.
Related Tutorial: How to Build a Waterfall Chart in Excel
16. Funnel Chart
A clustered column chart, or column chart, is used to display a series of two or more data sets in vertical clustered columns. The vertical columns are grouped together, because each data set shares the same axis labels. Clustered Columns are beneficial in directly comparing data sets.
Related Tutorial: How to Build a Funnel Chart in Excel
17. Combo Chart
A clustered column chart, or column chart, is used to display a series of two or more data sets in vertical clustered columns. The vertical columns are grouped together, because each data set shares the same axis labels. Clustered Columns are beneficial in directly comparing data sets.
Related Tutorial: How to Build a Combo Chart in Excel
Next Topic
How to Make a Clustered Column Chart
Thanks for checking out this tutorial. If you need additional help, you can check out some of our other free Excel Chart tutorials, or consider taking an Excel class with one of our professional trainers.