


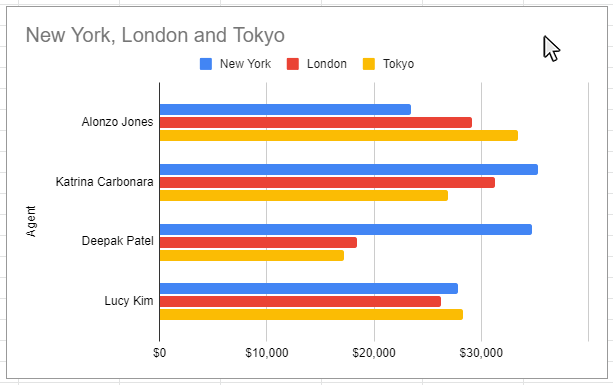
When creating a chart in Google Sheets, you may want to add a trendline to your chart to help users better visualize trends in the data over time. This tutorial will teach you how to add and format trendlines on your Google Sheets chart and graphs.
Trendlines are available for the following chart types:
- Area
- Bar
- Line
- Column
- Stock
- Scatter
- Bubble
Set Chart Options from the Setup tab on the Chart Editor panel
Step 1: Double-Click on a blank area of the chart to open the Chart Editor Panel
Use the cursor to double-click on a blank area on your chart. Doing this will open the Chart Editor panel.Make sure to click on a blank area in the chart. The border around the entire chart will become highlighted. Once you see the Chart Editor panel appear on the right side of the worksheet, then you know the chart setup and customization features are accessible.
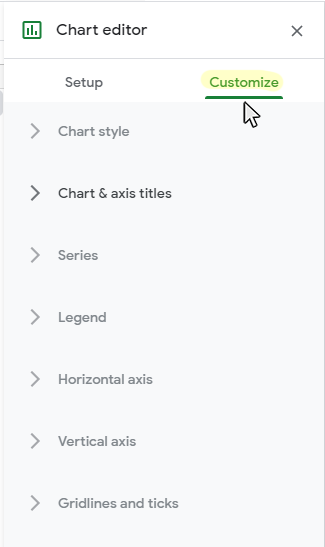
Step 2: Click on the Customize tab on the Chart Editor panel
Once the Chart Editor panel is visible, click the Customize tab to access the chart customization options.
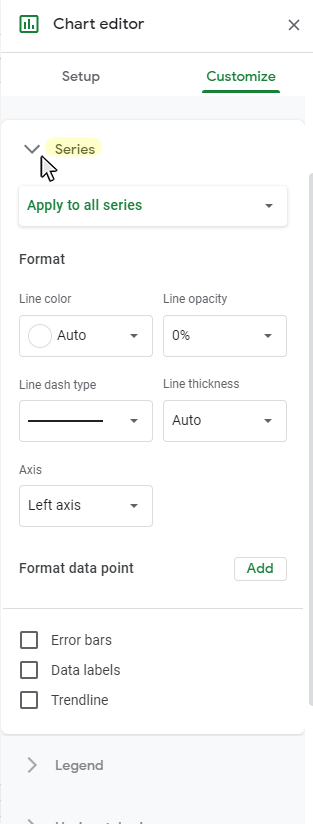
Step 3: Open the Series section on the Customize tab
Once the Customize Tab on the Editor panel is visible, click the Series section to access the data series customization options.
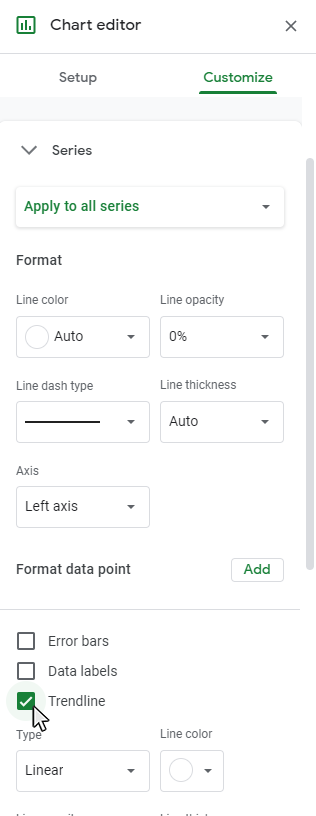
Step 4: Check the Trendline checkbox in the Series Section
Once the Chart Editor panel is visible, click the Customize tab to access the chart customization options.
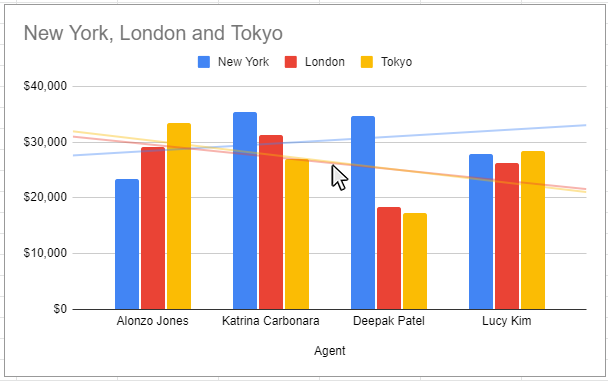
Result: Trendlines will appear on your chart
Once the Chart Editor panel is visible, click the Customize tab to access the chart customization options.
How to format Trendlines in Google Sheets
Once you check the Trendline checkbox, a sub-menu will appear. This submenu is where you will be able to apply formatting changes to your trendlines.
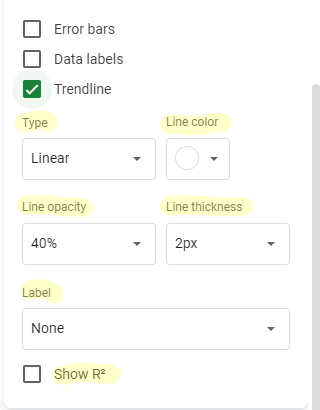
You are able to modify the following items on your trendlines:
- Type (of Trendline)
- Line Color
- Line Opacity
- Linear Forecast
- Line Thickness
- Label
- Show R²
How to change the type of Trendline on your chart
Based on the type of data you are working with, different types of Trendlines will be appropriate to use on your chart or graph.
Once you have turned on the Trendline option, you can select the type of Trendline you wish to appear on the chart. Click on dropdown menu named Type, and you will see options for the Trendline types on the chart.
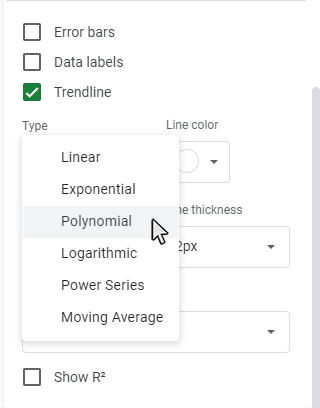
The Trendline Types available are:
- Linear
- Exponential
- Logarithmic
- Moving Average
- Polynomial
- Power Series
Topic #12
How to Make Dual Axis Charts in Google Sheets
Thanks for checking out this tutorial. If you need additional help, you can check out some of our other free Google Sheets Chart tutorials, or consider taking an Google Sheets class with one of our professional trainers.